- Part 1. How lithium batteries work
- Part 2. The charging curve – energy flowing in
- Part 3. The discharging curve – energy flowing out
- Part 4. Lithium-ion vs LiFePO4 discharge curves
- Part 5. Why are charge-discharge curves important?
- Part 6. Lithium battery voltage vs state of charge (SOC)
- Part 7. What affects the charge and discharge curve?
- Part 8. Conclusion
- Part 9. FAQs
In the world of lithium batteries, the charge-discharge curve is like a key. It unlocks profound insights into battery performance and working states. By studying these curves, we can decode the secrets behind a battery’s efficiency, capacity, and lifespan.
Let’s delve into the fascinating world of lithium battery charge-discharge curves and explore what makes them so crucial.
Part 1. How lithium batteries work
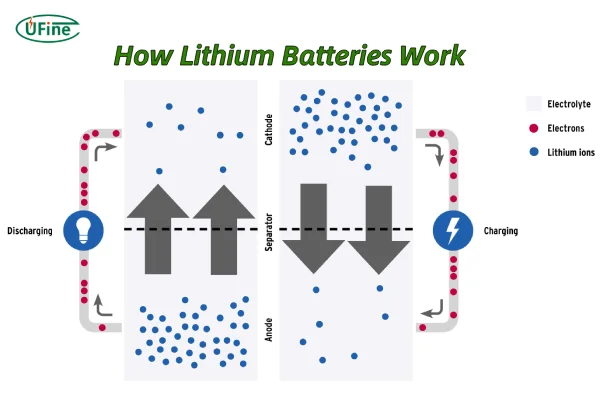
Firstly, we need to know how lithium batteries work. They work through a process involving the movement of lithium ions between two electrodes: the anode and the cathode.
Here’s a simplified breakdown of how they work:
Components:
- Anode: The negative electrode, typically made of graphite.
- Cathode: The positive electrode, made of a metal oxide like lithium cobalt oxide or lithium iron phosphate.
- Electrolyte: A liquid or gel-like substance that allows lithium ions to move between the electrodes.
- Separator: A porous membrane that separates the electrodes and prevents direct contact, but allows lithium ions to pass through.
Charging:
- When you connect a lithium-ion battery to a charger, an electric current is applied.
- This current causes lithium ions to move from the cathode to the anode, where they are stored within the graphite structure.
- As the lithium ions move, electrons flow through the external circuit to the anode.
Discharging:
- When you use the battery to power a device, the reverse process occurs.
- Lithium ions move from the anode to the cathode through the electrolyte.
- This movement of ions generates an electric current that powers the device.
Part 2. The charging curve – energy flowing in
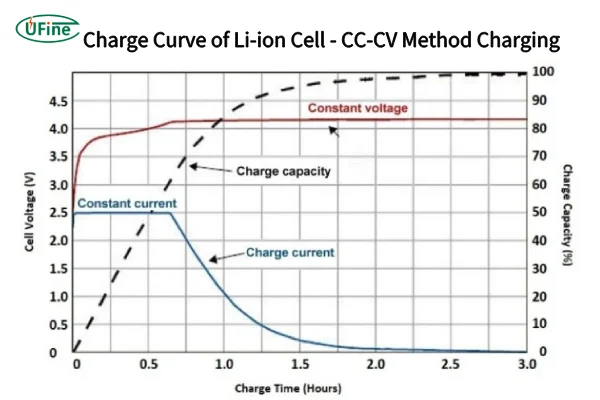
How to Read Lithium Battery Discharge Curve and Charging Curve?
When a lithium battery is plugged into a charger, complex chemical reactions quietly occur inside. These processes are reflected in the charging curve, which can be broken down into three phases:
1. Initial Charging Phase
At the start, the charging curve shows a steep rise in voltage. This happens because lithium ions, driven by the electric field, move quickly from the cathode (positive electrode) through the electrolyte to the anode (negative electrode).
Here, the internal resistance is low, allowing lithium ions to flow smoothly. Imagine these ions as eager residents finding new homes in the anode. The result? A rapid increase in voltage as energy is stored efficiently.
2. Middle Charging Phase
As charging progresses, the curve begins to flatten. Why? Because the cathode structure starts to change as it continues to release lithium ions. Meanwhile, the polarization effect intensifies.
Polarization occurs when resistance within the electrode and electrolyte slows the movement of ions. This reduced ion migration rate causes the voltage to increase more gradually, reflecting the increasing difficulty of storing energy in the anode.
3. Final Charging Phase
Toward the end, the curve levels off near the cutoff voltage. At this stage, the battery management system tightly regulates the charging current to prevent overcharging, which can lead to overheating, electrolyte breakdown, or structural damage to the electrodes.
By this point, most lithium ions have reached the anode, leaving only a few stragglers. Voltage growth slows to a crawl until the battery reaches full capacity, marking the end of the charging process.
Part 3. The discharging curve – energy flowing out
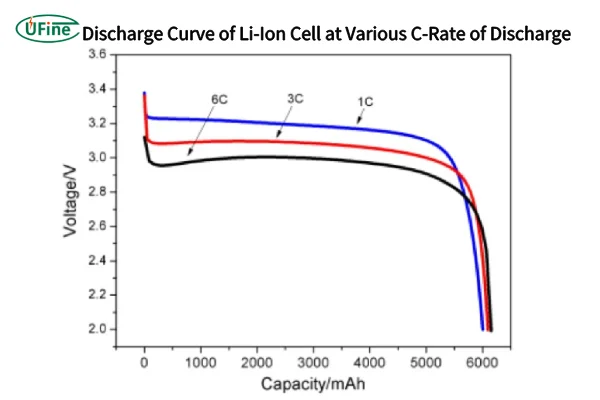
When a lithium battery powers a device, its discharging curve takes over, showcasing three distinct phases as well:
1. Initial Discharge Phase
Initially, the voltage remains stable and high. Lithium ions easily leave the anode and migrate back to the cathode, creating a steady current that powers the device.
Think of this stage as a factory operating smoothly with plenty of raw materials. Energy output is consistent and efficient.
2. Middle Discharge Phase
As discharge continues, the voltage gradually drops. The structure of the anode changes as lithium ions leave, increasing internal resistance. The polarization effect grows stronger, slowing ion migration.
This phase reflects the battery working harder to sustain output, much like a factory facing logistical challenges while still managing production.
3. Final Discharge Phase
In the last stage, voltage declines rapidly. Most lithium ions have been consumed, leaving too few to maintain a stable current. Internal reactions become erratic, signaling that the battery is nearly drained.
It’s akin to a factory running out of materials, causing production to collapse. If discharge continues past this point, irreversible damage can occur, reducing battery lifespan and capacity.
Part 4. Lithium-ion vs LiFePO4 discharge curves
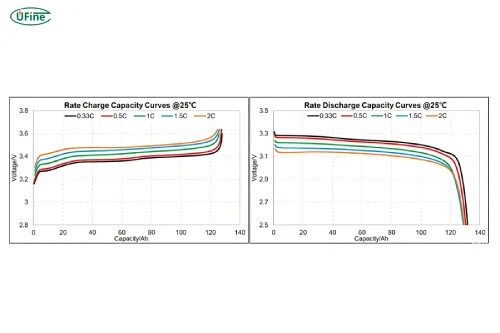
Different lithium battery chemistries show significantly different discharge curve behaviors. The two most common types are Lithium-Ion (NMC/NCA) and Lithium Iron Phosphate (LiFePO4).
Key Differences in Discharge Curves
| Feature | Lithium-Ion (NMC/NCA) | LiFePO4 |
|---|---|---|
| Nominal Voltage | 3.6–3.7V | 3.2V |
| Discharge Curve Shape | Gradual slope with mild plateau | Very flat plateau region |
| Voltage Drop Near Empty | Smooth and gradual | Sharp drop at end |
| SOC Estimation Accuracy | Easier using voltage | More difficult using voltage |
| Energy Density | Higher | Lower but more stable |
Lithium-ion batteries provide a more noticeable voltage change across the discharge process, making SOC estimation more intuitive.
In contrast, LiFePO4 batteries maintain a nearly flat voltage for most of the discharge cycle, which improves stability but makes voltage-based SOC estimation more challenging.
If you want to understand voltage differences in lithium chemistries, check this detailed guide on LiFePO4 voltage for more reference.
Part 5. Why are charge-discharge curves important?
Analyzing charge-discharge curves offers valuable insights into battery performance. Here’s why they matter:
-
Internal Resistance The curve’s slope reveals the battery’s internal resistance. A steep rise or drop indicates high resistance, which can reduce charging efficiency and output power.
-
Capacity Evaluation The plateau length and height reflect the battery’s capacity. A longer, higher plateau means the battery can store and release more energy, which is critical for evaluating its suitability for various applications.
-
Quality Assessment Consistency in the curve across multiple cycles indicates battery quality. Fluctuations or distortions suggest chemical instability or structural damage, which can shorten lifespan.
Charge Curve vs Discharge Curve Comparison
Although both processes involve lithium-ion movement, the charge curve and discharge curve behave differently.
| Feature | Charging Curve | Discharging Curve |
|---|---|---|
| Energy Flow | Into the battery | Out of the battery |
| Voltage Trend | Gradually increases | Gradually decreases |
| Key Phases | CC (Constant Current) + CV (Constant Voltage) | Plateau + voltage drop |
| End Behavior | Voltage stabilizes near cutoff | Voltage drops sharply near empty |
| Control System | Strictly controlled by BMS | Depends on load demand |
Understanding both curves is essential for designing efficient battery systems and ensuring safe operation.
Part 6. Lithium battery voltage vs state of charge (SOC)
One of the most practical applications of a lithium battery discharge curve is estimating the State of Charge (SOC), which represents how much energy is remaining in the battery.
Because voltage gradually decreases during discharge, SOC can be roughly estimated using voltage levels under controlled conditions.
Typical Lithium-Ion Battery Voltage vs SOC
| State of Charge (SOC) | Typical Voltage (3.7V Li-ion) |
|---|---|
| 100% | 4.20V |
| 90% | 4.10V |
| 80% | 4.00V |
| 70% | 3.92V |
| 60% | 3.85V |
| 50% | 3.80V |
| 40% | 3.76V |
| 30% | 3.72V |
| 20% | 3.68V |
| 10% | 3.50V |
| 0% | 3.00V |
It is important to note that SOC estimation based on voltage is not perfectly accurate because the discharge curve is not linear and can be affected by temperature, load current, and battery aging.
However, it is still widely used in basic battery monitoring systems due to its simplicity and low cost.
Part 7. What affects the charge and discharge curve?
1 How Discharge Rate (C-Rate) Affects the Curve
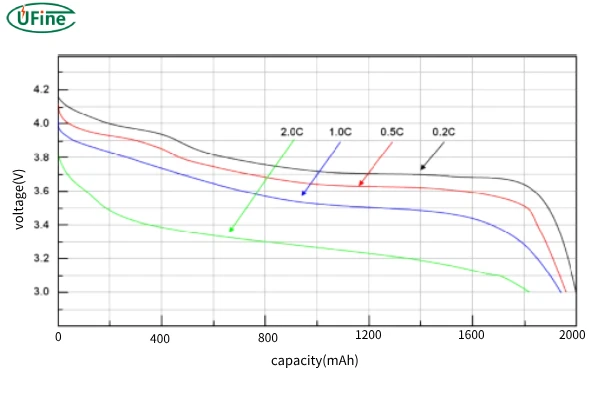
The discharge rate, also known as C-rate, has a significant impact on the shape of the lithium battery discharge curve.
At higher discharge rates, the battery delivers current more quickly, which increases internal resistance and polarization effects.
As a result:
- The voltage drops faster
- The plateau region becomes shorter
- The usable capacity decreases
For example:
- At 0.2C discharge, the curve remains relatively stable with higher usable capacity
- At 1C discharge, the curve follows normal behavior
- At 2C or higher, the voltage drops more quickly and the battery reaches cutoff earlier
This is why battery performance always depends on the operating load conditions, not just nominal capacity.
2 Effect of Temperature on Discharge Curve
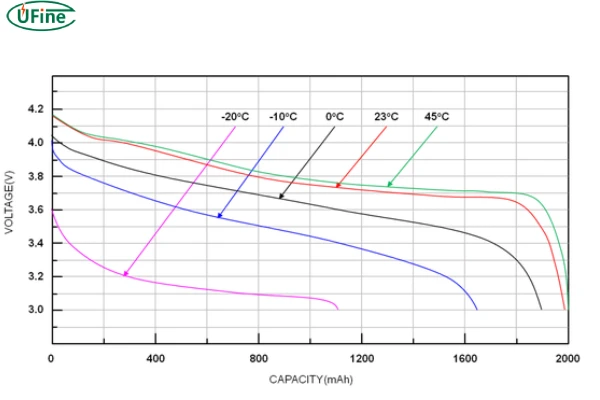
Temperature is another critical factor that affects the lithium battery discharge curve.
At low temperatures, the electrochemical reactions inside the battery slow down, and internal resistance increases.
This leads to:
- Lower overall voltage output
- Reduced usable capacity
- A steeper discharge curve under load
Typical temperature impact:
| Temperature | Relative Capacity |
|---|---|
| 25°C | 100% |
| 0°C | 80–90% |
| -10°C | 60–75% |
| -20°C | 40–60% |
At higher temperatures, performance may temporarily improve, but long-term exposure can accelerate battery degradation and reduce lifespan.
Battery performance is also highly affected by temperature, especially during extreme conditions, which is explained in this guide on extreme temperature charging and discharging.
Part 8. Conclusion
The charge-discharge curve serves as a vital window into a lithium battery’s health, performance, and suitability for various applications. By interpreting these curves, engineers and researchers can optimize battery design, extend lifespan, and enhance safety.
From powering electric vehicles to energizing portable devices, understanding charge-discharge curves plays a key role in advancing battery technology. As we continue to explore the intricacies of lithium batteries, we pave the way for innovations in renewable energy and sustainable technologies.
Part 9. FAQs
What is the difference between open-circuit voltage and discharge voltage?
Open-circuit voltage (OCV) is measured when the battery is not under load, while discharge voltage is measured during operation. Discharge voltage is always lower due to internal resistance and polarization effects.
Why does a lithium battery hold voltage so well during discharge?
Because lithium-ion chemistry has a stable electrochemical reaction zone, which allows a long plateau region where voltage changes very slowly despite capacity being used.
What is the cutoff voltage in lithium-ion batteries?
Cutoff voltage is the minimum safe voltage level (usually around 2.5V–3.0V per cell) where discharge must stop to prevent irreversible damage and capacity loss.
How does internal resistance change during battery discharge?
Internal resistance increases as the battery discharges due to chemical depletion and structural changes inside electrodes, which leads to faster voltage drop near the end.
Why do lithium batteries show a voltage plateau?
The plateau occurs because lithium ions are inserted/extracted at nearly constant chemical potential over a wide range of SOC, resulting in stable voltage output.
Can discharge curves be used to predict battery lifespan?
Yes. Changes in curve shape over cycles (like shorter plateau or earlier voltage drop) indicate aging and capacity degradation.
Related Tags:

More Articles
Dead Battery or Device Failure? How to Find the Cause
Think your device is broken? Learn how to tell if the problem comes from battery aging or hardware failure before replacing your electronics.
Why iPhone Duo Uses Two Batteries: The Engineering Behind Foldable Phone Power
Why do foldable phones need two batteries? Explore the engineering challenges behind iPhone Duo’s dual-battery architecture and future battery trends.
Solid-State Batteries: 3 Myths You Need to Know
Solid-state batteries promise safer EVs and longer range, but the reality is more complex. Discover the challenges behind this next-gen technology.
Battery Capacity vs Discharge Rate: The Choice Engineers Face
Higher capacity or higher discharge rate? Learn how to choose the right LiPo battery for longer runtime, stable power output, and better device performance.
Battery Cable Size Guide: Choose the Right Wire Fast
Not sure what battery cable size you need? Learn how to select the right wire gauge, terminal size, and cable for safer, more efficient battery systems.