- Part 1. What is the lithium battery discharge curve?
- Part 2. How to analyze the lithium battery discharge curve?
- Part 3. What affects the discharge curve of lithium-ion batteries?
- Part 4. What is the lithium battery charging curve?
- Part 5. How to analyze the lithium battery charging curve?
- Part 6. FAQs
The performance of lithium batteries is critical to the operation of various electronic devices and power tools. The lithium battery discharge curve and charging curve are important means to evaluate the performance of lithium batteries. It can intuitively reflect the voltage and current changes of the battery during charging and discharging. Information on critical parameters such as battery capacity, internal resistance, and efficiency can be obtained by analyzing the discharge curve and charging curve of lithium batteries.
Part 1. What is the lithium battery discharge curve?
When a lithium battery is discharged, its operating voltage constantly changes over time. Using the battery’s operating voltage as the ordinate, discharge time, capacity, state of charge (SOC), or depth of discharge (DOD) as the abscissa, the curve drawn is called the lithium battery discharge curve.
The most basic forms of discharge curves are voltage-time and current-time curves. Common discharge curves include voltage-capacity (specific capacity) curve, voltage-energy (specific energy) curve, voltage-SOC curve, etc.
The lithium battery discharge curve is a curve in which the capacity of a lithium battery changes with the change of the discharge current at different discharge rates.
Specifically, its discharge curve shows a gradually declining characteristic when a lithium battery is operated at a lower discharge rate (such as C/2, C/3, C/5, C/10, etc.). This shows that as the discharge time increases, the capacity of the lithium battery will gradually decrease.
In addition, when the lithium battery is discharged faster (1C, 2C, 3C, 5C, etc.), its discharge curve shows a stable level. This shows that even if the discharge time is long, the capacity of the lithium battery will not change much.
Part 2. How to analyze the lithium battery discharge curve?
During the discharge process of lithium batteries, the voltage gradually decreases, and the current also decreases. The shape and slope of a lithium battery’s discharge curve can also provide important information about battery performance.
1. Li-ion Battery Discharge Curve Analysis
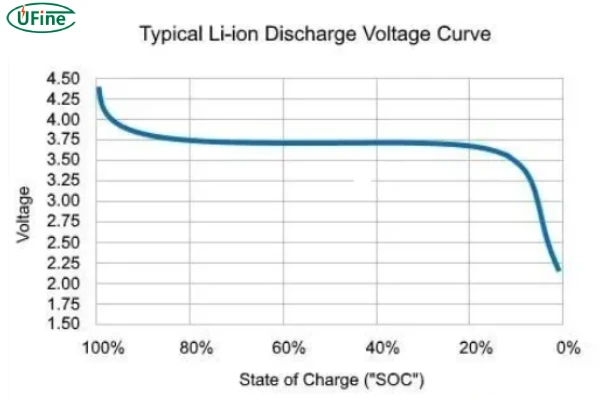
Lithium Battery Discharge Curve:
The slope of the lithium battery discharge curve can reflect the discharge performance of the battery. A flatter lithium battery discharge curve usually indicates that the lithium battery has better discharge stability and can provide stable energy output. In addition, by observing the plateau area of the lithium battery discharge curve, we can understand the battery’s voltage changes at different discharge depths. This evaluates the discharge capacity of the lithium battery.
2. Discharge Capacity Curve Analysis
Lithium Battery Discharge Capacity Curve:
The area of the lithium battery discharge curve is proportional to the discharge time. Therefore, the discharge capacity of lithium batteries can be evaluated by calculating the area under the curve. The discharge capacity of lithium batteries directly affects the usage time and endurance of lithium batteries.
3. Internal Resistance of the Lithium Battery Curve Analysis
[Guide] Ways to Measure Lithium Battery Internal Resistance
Lithium Battery Discharge Curve Internal Resistance:
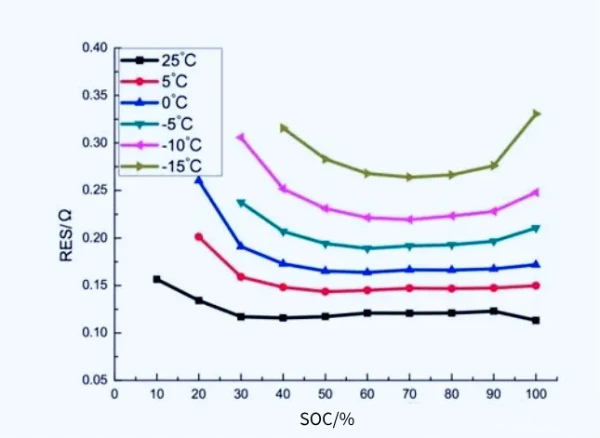
Internal resistance is the resistance inside the lithium battery, which affects its discharge characteristics. Higher internal resistance will cause the voltage to drop faster and the discharge power to drop. Smaller internal resistance helps improve the battery’s discharge efficiency and power output.
By analyzing the lithium battery discharge curve, the internal resistance of the lithium battery can be estimated, and its impact on battery performance can be evaluated. In addition, the size of the internal resistance is also related to the health status of the lithium battery. Therefore, internal resistance evaluation can also be used to diagnose battery faults.
4. Evaluate Capacity By Analyzing Battery Discharge Curve
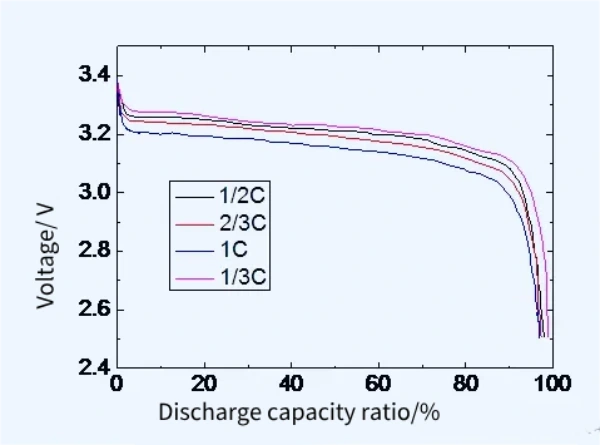
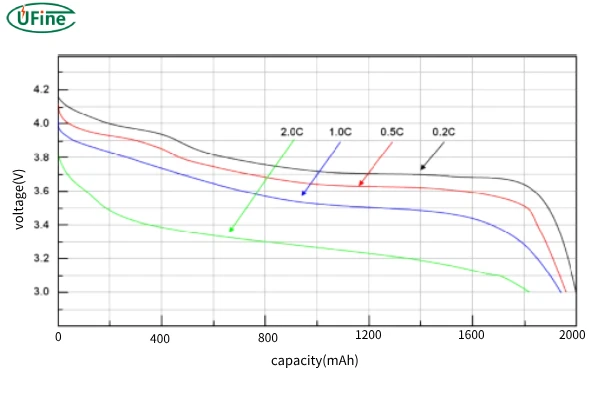
Lithium Battery Capacity and C Rate Curve:
The capacity of a lithium battery refers to the amount of charge the battery can store. It is usually expressed in milliamp-hours (mAh) or ampere-hours (Ah). By integrating the lithium battery charge curve and discharge curve, the actual capacity of the lithium battery can be calculated. At the same time, multiple charge and discharge cycle tests can also be performed to observe the attenuation of capacity. This can be used to evaluate the cycle life of lithium batteries.
5. Evaluate Lithium Battery Cycle Life by Analyzing the Discharge Curve
Lithium Battery Voltage and Cycle Life Curve:
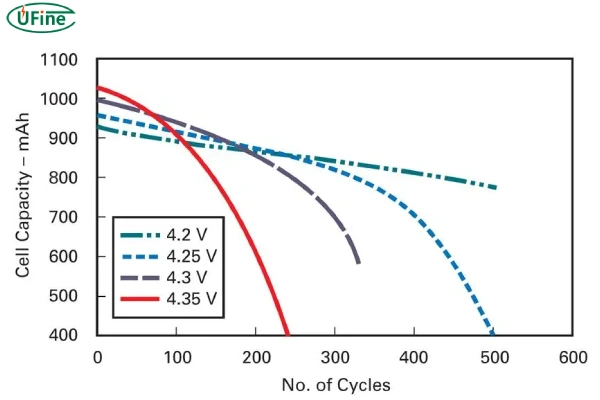
Cycle life refers to the ability of a battery to maintain certain performance after multiple charge and discharge cycles. By observing the changes in the charge-discharge curve over multiple cycles, the battery’s cycle life can be evaluated. Suppose the shape and characteristics of the curve remain relatively stable after multiple cycles. In that case, the battery has a good cycle life. At the same time, the capacity attenuation during the cycle can also be analyzed to predict the battery’s service life.
Part 3. What affects the discharge curve of lithium-ion batteries?
The discharge curve of lithium-ion batteries is influenced by several factors.
1. Battery Chemistry
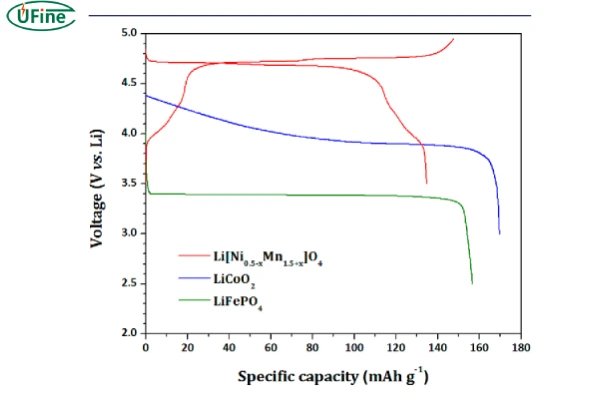
Different lithium-ion chemistries (e.g., LiCoO2, LiFePO4, LiMn2O4) have distinct discharge profiles and characteristics.
Discharge Curves of Different Types of Batteries:
2. State of Charge (SOC)
The SOC at the start of discharge significantly affects the voltage curve. Higher SOCs generally start at higher voltages.
3. Discharge Rate (C-rate)
The rate at which the battery is discharged, expressed as a multiple of its capacity (e.g., 1C, 2C), impacts the voltage drop due to internal resistance and polarization effects. Higher discharge rates typically cause more significant voltage drops.
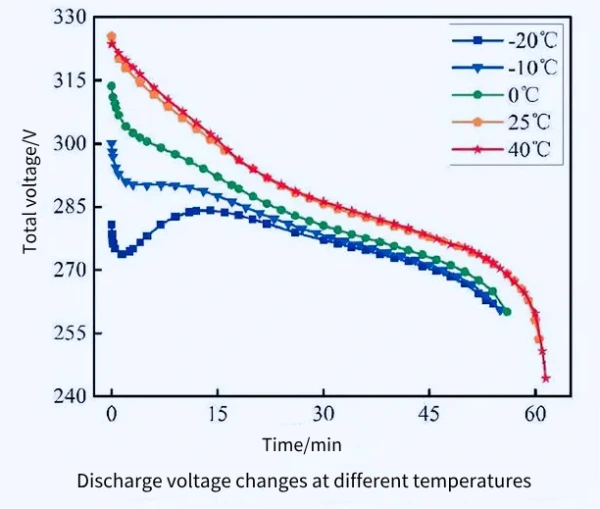
4. Temperature
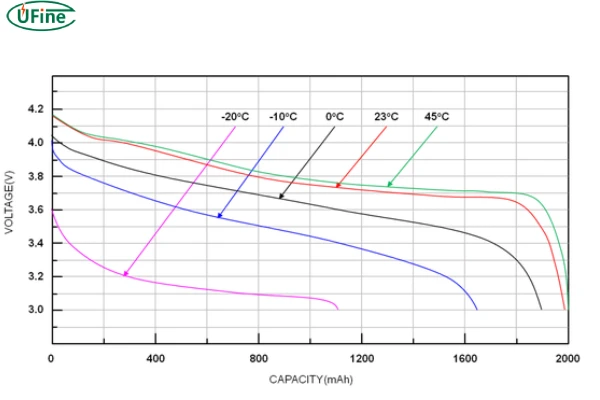
Operating temperature affects the battery’s internal resistance and reaction kinetics. Extreme temperatures (both high and low) can lead to increased resistance and altered discharge characteristics.
Battery Charging and Discharging at Extreme Temperatures
Discharge Curve of Lithium Batteries at Different Temperatures:
5. Battery Age and Cycle Life:
As batteries age and go through more charge-discharge cycles, their internal resistance increases, and capacity decreases, altering the discharge curve.
6. Manufacturing Variations:
Differences in materials, construction, and quality control during manufacturing can cause variations in discharge curves between seemingly identical batteries.
7. Load Conditions:
The nature of the load (constant current, constant power, or variable load) affects how the battery discharges. Constant power loads, for example, will lead to a different voltage drop pattern compared to constant current loads.
8. Internal Impedance:
The battery’s internal impedance, which can be influenced by factors like electrode material and electrolyte composition, affects how much the voltage drops under load.
9. Electrolyte Composition:
The composition and concentration of the electrolyte can influence ionic conductivity and, subsequently, the voltage profile during discharge.
10. Cell Balancing and Configuration:
In battery packs, cell balancing and the configuration (series, parallel) impact the overall discharge characteristics.
11. State of Health (SOH):
The overall condition of the battery, including factors like capacity fade and increased impedance, alters the discharge curve as the battery degrades over time.
Part 4. What is the lithium battery charging curve?
Lithium Battery Charging Curve:
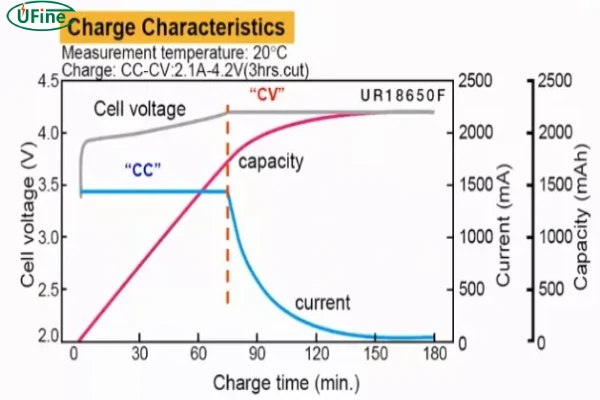
The lithium battery charging curve illustrates how the battery’s voltage and current change during the charging process. Typically, it consists of several distinct phases:
- Constant Current (CC) Phase: In this initial phase, the charger applies a constant current to the battery until it reaches a predetermined voltage threshold. During this phase, the battery voltage gradually increases.
- Constant Voltage (CV) Phase: Once the battery voltage reaches the predefined threshold, the charger switches to a constant voltage mode. The voltage remains steady, and the current gradually decreases as the battery approaches full capacity.
- Trickle Charge (Float) Phase: Some chargers may enter a trickle or float phase after reaching full capacity. In this phase, a low, steady current is applied to compensate for self-discharge and maintain the battery at full capacity.
Understanding the lithium battery charging curve helps ensure efficient and safe charging, preventing overcharging or undercharging, which can degrade battery performance and lifespan.
Part 5. How to analyze the lithium battery charging curve?
The discharge curve and charging curve of a lithium battery are the relationship between the voltage and the discharge capacity of the lithium battery. They are also the curves of the remaining capacity SOC.
During the charging process of a lithium battery, the voltage gradually increases, and the current gradually decreases. The slope of the lithium battery charging curve reflects the fast charging speed. , the greater the slope, the faster the charging speed. At the same time, the platform area of the lithium battery charging curve indicates that the battery is fully charged, and the voltage tends to be stable at this time.
1. Charging efficiency analysis
Charging efficiency is an important indicator for measuring the charging performance of lithium batteries. Higher charging efficiency means that the battery can more effectively convert the input electrical energy into chemical energy and store it. The charging efficiency can be evaluated by comparing the actual charging capacity and the theoretical charging capacity of the charging curve.
In addition, the energy loss during charging can also be observed to find ways to improve charging efficiency.
2. Charge termination voltage
The charge termination voltage refers to the voltage value when the lithium battery is fully charged. Correctly setting the charge termination voltage can avoid overcharging and extend battery life. The appropriate charge termination voltage can be determined by analyzing the lithium battery charging curve. This ensures that the lithium battery is charged within a safe range.
Part 6. FAQs
-
What does a typical lithium battery discharge curve look like?
A typical curve starts with a relatively flat voltage plateau during the initial phase of discharge, followed by a gradual decline in voltage until reaching the end of discharge, where voltage drops rapidly. -
How does discharge rate affect the curve?
Higher discharge rates can cause the voltage to drop more quickly, leading to a steeper curve. Lower discharge rates result in a shallower curve with more gradual voltage decline. -
What is the significance of the voltage plateau in the curve?
The voltage plateau represents the battery’s stable output voltage during the early stages of discharge. It indicates the battery’s ability to deliver consistent power for a certain period. -
Why does voltage drop towards the end of discharge?
As the battery depletes its energy, internal resistance increases, causing voltage to drop more rapidly. This phenomenon is more pronounced in older or heavily used batteries. -
Are there differences in discharge curves between lithium-ion and lithium-polymer batteries?
While both types of batteries exhibit similar discharge characteristics, there may be slight variations in their curves due to differences in cell chemistry and construction. -
Can temperature affect discharge curves?
Yes, temperature can influence the shape and slope of discharge curves. Lower temperatures typically result in higher internal resistance, leading to flatter and less consistent curves. -
How can I use discharge curves to optimize battery usage?
By monitoring discharge curves, users can identify optimal operating conditions, such as selecting appropriate discharge rates and avoiding deep discharges, to prolong battery life and enhance performance.
Related Tags:

More Articles

Watt Hours to Amp Hours: Calculate and Compare
Learn how to convert Wh to Ah using simple formulas. Understand battery capacity in watt-hours and amp-hours for accurate sizing.
What Is the Right Watch Battery Voltage for Your Timepiece? A Complete Guide
Learn watch battery voltage types: 1.5V silver oxide, 3V coin cells, and 3.7V smartwatch lithium batteries. Choose the right battery for your device.
PCM vs PCB vs BMS: What is the Difference in LiPo Battery?
Learn PCM vs PCB vs BMS in LiPo batteries. Compare protection module, circuit board, and battery management system functions and key differences.
Which is the Best Lithium Battery?
What is the best lithium battery? Compare Li-ion, LiFePO4, LiPo, and LTO batteries by safety, lifespan, cost, and performance.
Are Lithium-Ion Batteries Safe?
Are lithium-ion batteries safe? Learn key safety risks, thermal runaway causes, fire prevention tips, and safe battery handling practices.