- Part 1. What is a discharge curve for lithium ion battery?
- Part 2. What information does a battery discharge curve reveal?
- Part 3. How discharge rate changes the discharge curve
- Part 4. How temperature affects a lithium ion battery discharge curve
- Part 5. Comparing different batteries through their discharge curves
- Part 6. How battery engineers use discharge curves in device design
- Part 7. What a good discharge curve looks like
- Part 8. How to read a battery discharge curve correctly
- Part 9. FAQs
A specification sheet may tell you that a battery is 3.7V and 1000mAh, but those two numbers cannot tell you how the battery behaves when the device draws current.
This is where a discharge curve for lithium ion battery becomes valuable.
A discharge curve shows how battery voltage changes as the battery delivers energy under defined test conditions. By analyzing the curve, engineers can learn about voltage stability, usable capacity, voltage sag, discharge-rate performance, temperature behavior, and end-of-discharge characteristics.
In other words, a discharge curve helps turn a battery specification into useful engineering data.
Key takeaways
- A discharge curve reveals much more than a battery’s nominal capacity.
- Voltage stability shows how consistently a battery can power a device throughout its discharge cycle.
- Higher discharge rates generally increase voltage sag and can reduce usable capacity.
- Temperature can significantly change internal resistance, voltage behavior, and available capacity.
- Cutoff voltage determines how much of a battery’s rated capacity a device can actually use.
- Two lithium-ion batteries with the same voltage and capacity can have very different discharge characteristics.
Part 1. What is a discharge curve for lithium ion battery?
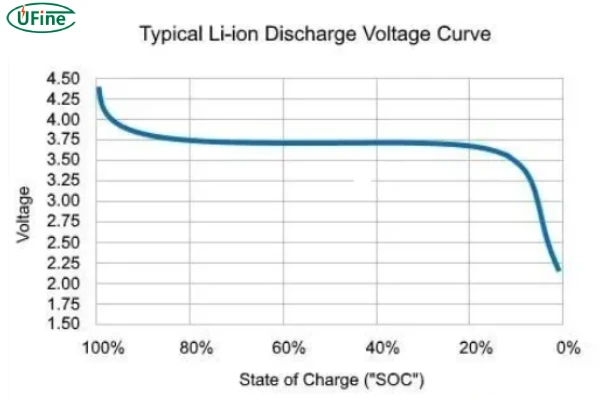
A discharge curve for lithium ion battery is a graph that describes how the battery’s voltage changes during discharge.
Depending on the test method, the horizontal axis may represent:
- Discharge time
- Discharged capacity
- State of charge (SOC)
The vertical axis normally represents battery voltage.
A typical single-cell lithium-ion or LiPo battery may begin a discharge test at approximately 4.2V when fully charged. Its voltage then falls during discharge, often followed by a relatively stable region, before dropping more rapidly near the end of the discharge cycle.
The exact shape is not universal.
It depends on factors including:
- Battery chemistry
- Electrode design
- Cell construction
- Discharge current
- C-rate
- Temperature
- Cutoff voltage
- State of charge
- Battery age
This means the discharge curve is not simply a measurement of capacity. It is a representation of how the battery behaves under specific operating conditions.
Part 2. What information does a battery discharge curve reveal?

A discharge curve can provide engineers with information that cannot be obtained from nominal voltage and capacity alone.
Usable capacity
A battery rated at 1000mAh does not necessarily provide 1000mAh of usable capacity to every device.
The actual amount of energy available depends on the discharge conditions and the voltage at which the device stops operating.
For example, suppose a device requires at least 3.3V to operate correctly. If the battery voltage falls below 3.3V before the rated capacity has been completely discharged, the remaining capacity may not be useful to that device.
This is why engineers should distinguish between:
Rated capacity and usable capacity.
The discharge curve makes this difference much easier to understand.
Voltage stability
The shape of the curve also shows how stable the battery voltage remains during operation.
A relatively flat discharge region means the battery can maintain a relatively consistent voltage over a substantial portion of its discharge cycle.
This can be valuable for electronic devices that require stable input voltage.
For example, a portable electronic product may operate normally at 3.8V, but its performance could change as the battery voltage gradually falls toward 3.4V or 3.3V.
A battery with better voltage stability may therefore provide more predictable device performance.
Voltage sag and internal resistance
One of the most useful things engineers can learn from discharge testing is how the battery responds to load.
When current increases, the battery’s terminal voltage can drop. This is commonly known as voltage sag.
A simplified relationship is:
Vₜ = Vₒc − I × R
where:
- Vₜ = terminal voltage
- Vₒc = open-circuit voltage
- I = load current
- R = effective internal resistance
The equation is simplified because real battery behavior also involves electrochemical polarization and dynamic effects.
Nevertheless, the principle is useful: higher current and higher effective resistance generally produce greater voltage drop.
This becomes particularly important in applications with sudden current peaks.
A robotics system, wireless transmitter, motorized device, or portable electronic product may have relatively low average current but significantly higher peak current.
If the battery cannot maintain its voltage during those peaks, the device may reset, shut down, or experience unstable performance.
End-of-discharge behavior
The final part of the discharge curve deserves particular attention.
Near the end of discharge, battery voltage often decreases more rapidly. Once the voltage reaches the device’s cutoff threshold, the system may shut down.
Importantly, this does not necessarily mean that every lithium-ion battery has physically reached zero stored energy.
Instead, the remaining energy may no longer be accessible within the voltage limits of the device.
This is why a battery with a larger nominal capacity does not automatically guarantee longer runtime.
Part 3. How discharge rate changes the discharge curve
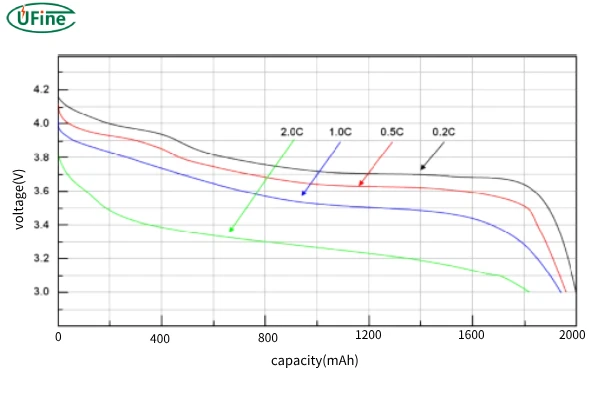
Discharge rate is usually expressed using C-rate.
For example, a 1000mAh battery discharged at 1C supplies approximately 1000mA. At 0.5C, the current is approximately 500mA.
| C-rate | Current for a 1000mAh battery | Theoretical discharge time |
|---|---|---|
| 0.2C | 200mA | 5 hours |
| 0.5C | 500mA | 2 hours |
| 1C | 1000mA | 1 hour |
| 2C | 2000mA | 30 minutes |
| 5C | 5000mA | 12 minutes |
These theoretical times assume ideal conditions. Real battery performance can be different.
As discharge current increases, internal voltage losses become more significant. The battery may reach its cutoff voltage sooner, resulting in lower measured usable capacity.
This leads to an important engineering rule:
Do not evaluate a battery at a discharge rate that is significantly lower than the actual application load.
For example, if a device regularly operates around 2C, a discharge curve measured only at 0.2C may give engineers an overly optimistic impression of runtime and voltage stability.
Part 4. How temperature affects a lithium ion battery discharge curve
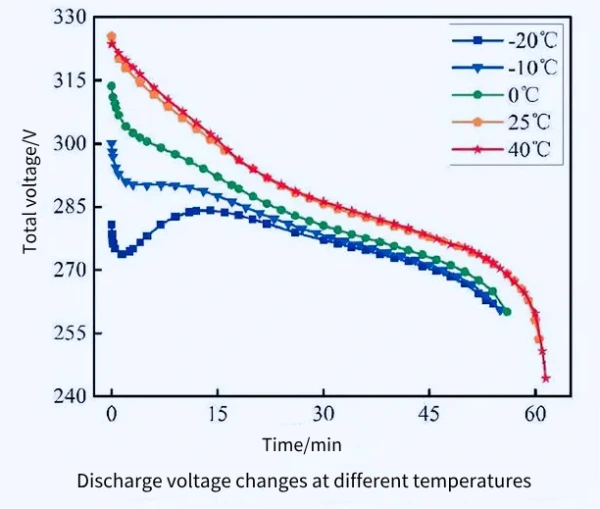
Temperature can have a major influence on lithium-ion battery performance.
At lower temperatures, electrochemical reactions and ion transport can become less favorable. Internal resistance can increase, resulting in greater voltage sag under load.
This can produce a discharge curve that looks significantly different from one measured at room temperature.
For example, a battery tested at 25°C may maintain sufficient voltage for a device throughout most of its capacity. The same battery operating at a much lower temperature may experience a larger voltage drop under the same load.
This is particularly relevant to:
- Wearable electronics
- Outdoor electronics
- Portable medical devices
- GPS devices
- Industrial handheld equipment
- Battery-powered sensors
Therefore, if a product is expected to operate across a wide temperature range, engineers should not rely solely on a room-temperature discharge curve.
Part 5. Comparing different batteries through their discharge curves
Discharge curves become especially useful when comparing batteries with similar specifications.
Consider two batteries:
- 3.7V nominal voltage
- 1000mAh rated capacity
On paper, they appear almost identical.
In practice, however, one may have lower internal resistance and maintain its voltage better under load. The other may experience greater voltage sag but have similar performance under low-current conditions.
The curves can reveal this difference.
| Battery characteristic | What the discharge curve can reveal |
|---|---|
| Capacity | How much capacity is actually usable |
| Voltage stability | How consistently voltage is maintained |
| Voltage sag | How the battery responds to load |
| C-rate performance | Performance under different current demands |
| Temperature response | Changes under different operating temperatures |
| Cutoff behavior | How quickly voltage falls near the end of discharge |
This is one of the most important lessons for battery engineers:
The same voltage and mAh rating do not guarantee the same real-world performance.
Part 6. How battery engineers use discharge curves in device design
The value of a discharge curve becomes much greater when it is used during product development.
Selecting the right battery voltage
Engineers need to consider the battery’s entire operating voltage range rather than focusing only on nominal voltage.
For example, a typical single-cell LiPo battery may be described as a 3.7V battery, but its actual voltage changes substantially between full charge and the end of discharge.
The device’s minimum operating voltage must therefore be compatible with the battery’s actual discharge profile.
Estimating runtime
A common preliminary calculation is:
Runtime = Battery capacity ÷ Load current
This is useful for a rough estimate, but it is not a complete runtime model.
Actual runtime can be affected by:
- Discharge rate
- Cutoff voltage
- Temperature
- Battery aging
- Device power-management efficiency
- Variable load profile
- Voltage conversion losses
For example, a 1000mAh battery supplying a constant 500mA load has a theoretical runtime of two hours. However, the actual device may shut down earlier if its minimum operating voltage is reached before the full rated capacity is delivered.
The discharge curve helps engineers make this estimate more realistic.
Designing the power management system
Discharge data can also influence power-management design.
Engineers can use the curve when selecting:
- DC-DC converters
- Voltage regulators
- Low-voltage cutoff thresholds
- Battery protection circuits
- Power-management strategies
Suppose a device normally operates above 3.3V. During a sudden current spike, the battery voltage temporarily drops to 3.2V.
Even if the battery still contains substantial energy, the device could interpret this voltage drop as an undervoltage condition.
The problem may therefore not be insufficient capacity. It may be insufficient voltage performance under load.
Choosing between battery designs
Battery selection should therefore go beyond choosing the highest mAh rating.
Engineers may need to balance:
- Capacity
- Physical dimensions
- Continuous discharge current
- Peak current
- Voltage stability
- Operating temperature
- Cycle life
- Weight
- Protection requirements
For compact consumer electronics, a battery with slightly lower capacity but better voltage stability under the actual load may deliver better overall performance than a higher-capacity battery with excessive voltage sag.
Part 7. What a good discharge curve looks like
There is no single discharge curve that is ideal for every application.
The requirements of a wearable device are different from those of a robotic actuator or portable industrial instrument.
For a wearable device, engineers may prioritize compact size, usable capacity, and predictable voltage behavior.
For a robotics application, low voltage sag and high-rate discharge capability may be more important.
For portable consumer electronics, a useful battery may need to maintain stable voltage through most of the operating cycle while providing sufficient usable capacity before the system reaches its minimum voltage.
In general, engineers may look for:
- Stable voltage across the useful discharge range
- Low voltage sag under the target load
- Predictable end-of-discharge behavior
- Consistent performance between cells
- Adequate capacity at the required C-rate
So, a good discharge curve is application-dependent.
Part 8. How to read a battery discharge curve correctly
Before comparing two discharge curves, you need to check the test conditions.
Step 1: Check the discharge rate
A curve measured at 0.2C should not be directly compared with one measured at 2C without considering the effect of current.
Step 2: Check the temperature
A curve measured at 25°C may look very different from one measured at 0°C.
Step 3: Check the cutoff voltage
Different cutoff voltages can produce different measured capacities.
Step 4: Check the load profile
A constant-current test does not necessarily represent a device that alternates between standby, active operation, and high-current peaks.
Step 5: Compare the usable region
Instead of looking only at the total area under the curve, identify the portion of the discharge curve that falls within the device’s actual operating voltage range.
Step 6: Match the data to the application
The most useful discharge curve is the one measured under conditions that resemble the real product.
This is especially important for custom battery development, where the battery must be designed around a specific device rather than a generic specification.
Part 9. FAQs
1. Can a discharge curve predict battery performance over time?
It can help estimate performance, but battery aging changes capacity and internal resistance. Engineers should compare discharge curves from new and aged cells to evaluate degradation.
2. Can discharge curves be used to estimate state of charge?
Yes. Voltage measurements can provide an approximate indication of state of charge, although voltage-based estimation becomes less accurate when the battery is under load or when temperature varies.
3. Does battery aging change the discharge curve?
Yes. As a lithium-ion battery ages, capacity typically decreases and internal resistance increases. This can cause greater voltage sag and an earlier voltage drop during discharge.
4. Can a discharge curve help identify a defective battery?
It can help. An abnormal curve, unusually large voltage drop, significantly reduced capacity, or inconsistent behavior between cells may indicate degradation or a manufacturing issue. Additional electrical and safety tests are normally required for confirmation.
5. Why should battery cells be tested individually before pack assembly?
Testing individual cells helps identify differences in capacity, voltage behavior, and internal resistance. Matching cells can improve pack consistency and reduce imbalance during operation.
Related Tags:

More Articles

Buck vs. Boost vs. Buck-Boost Converter: Which Is Best for Battery?
Not sure which converter your battery-powered device needs? Compare Buck, Boost, and Buck-Boost designs and discover what affects voltage stability and runtime.
How to Match 18650 Cells for a Reliable Battery Pack?
Building an 18650 battery pack? Learn how to compare cell capacity, voltage, and internal resistance to avoid mismatches and improve reliability.
Why Do 18650 Battery Packs Get Hot During Discharge?
Is your 18650 battery pack overheating under load? Learn what causes excess heat, how to spot dangerous symptoms, and what to do next.
18650 Battery BMS: How to Get the Specs Right
Learn how to choose a BMS for an 18650 battery pack. Compare voltage, current ratings, protection features, and balancing before you buy.
Why Does My Ring Camera Battery Drain So Fast or Stop Charging?
Is your Ring camera battery draining fast or not charging? Discover common causes, practical fixes, and when to replace the battery.